How do I use trade signals?
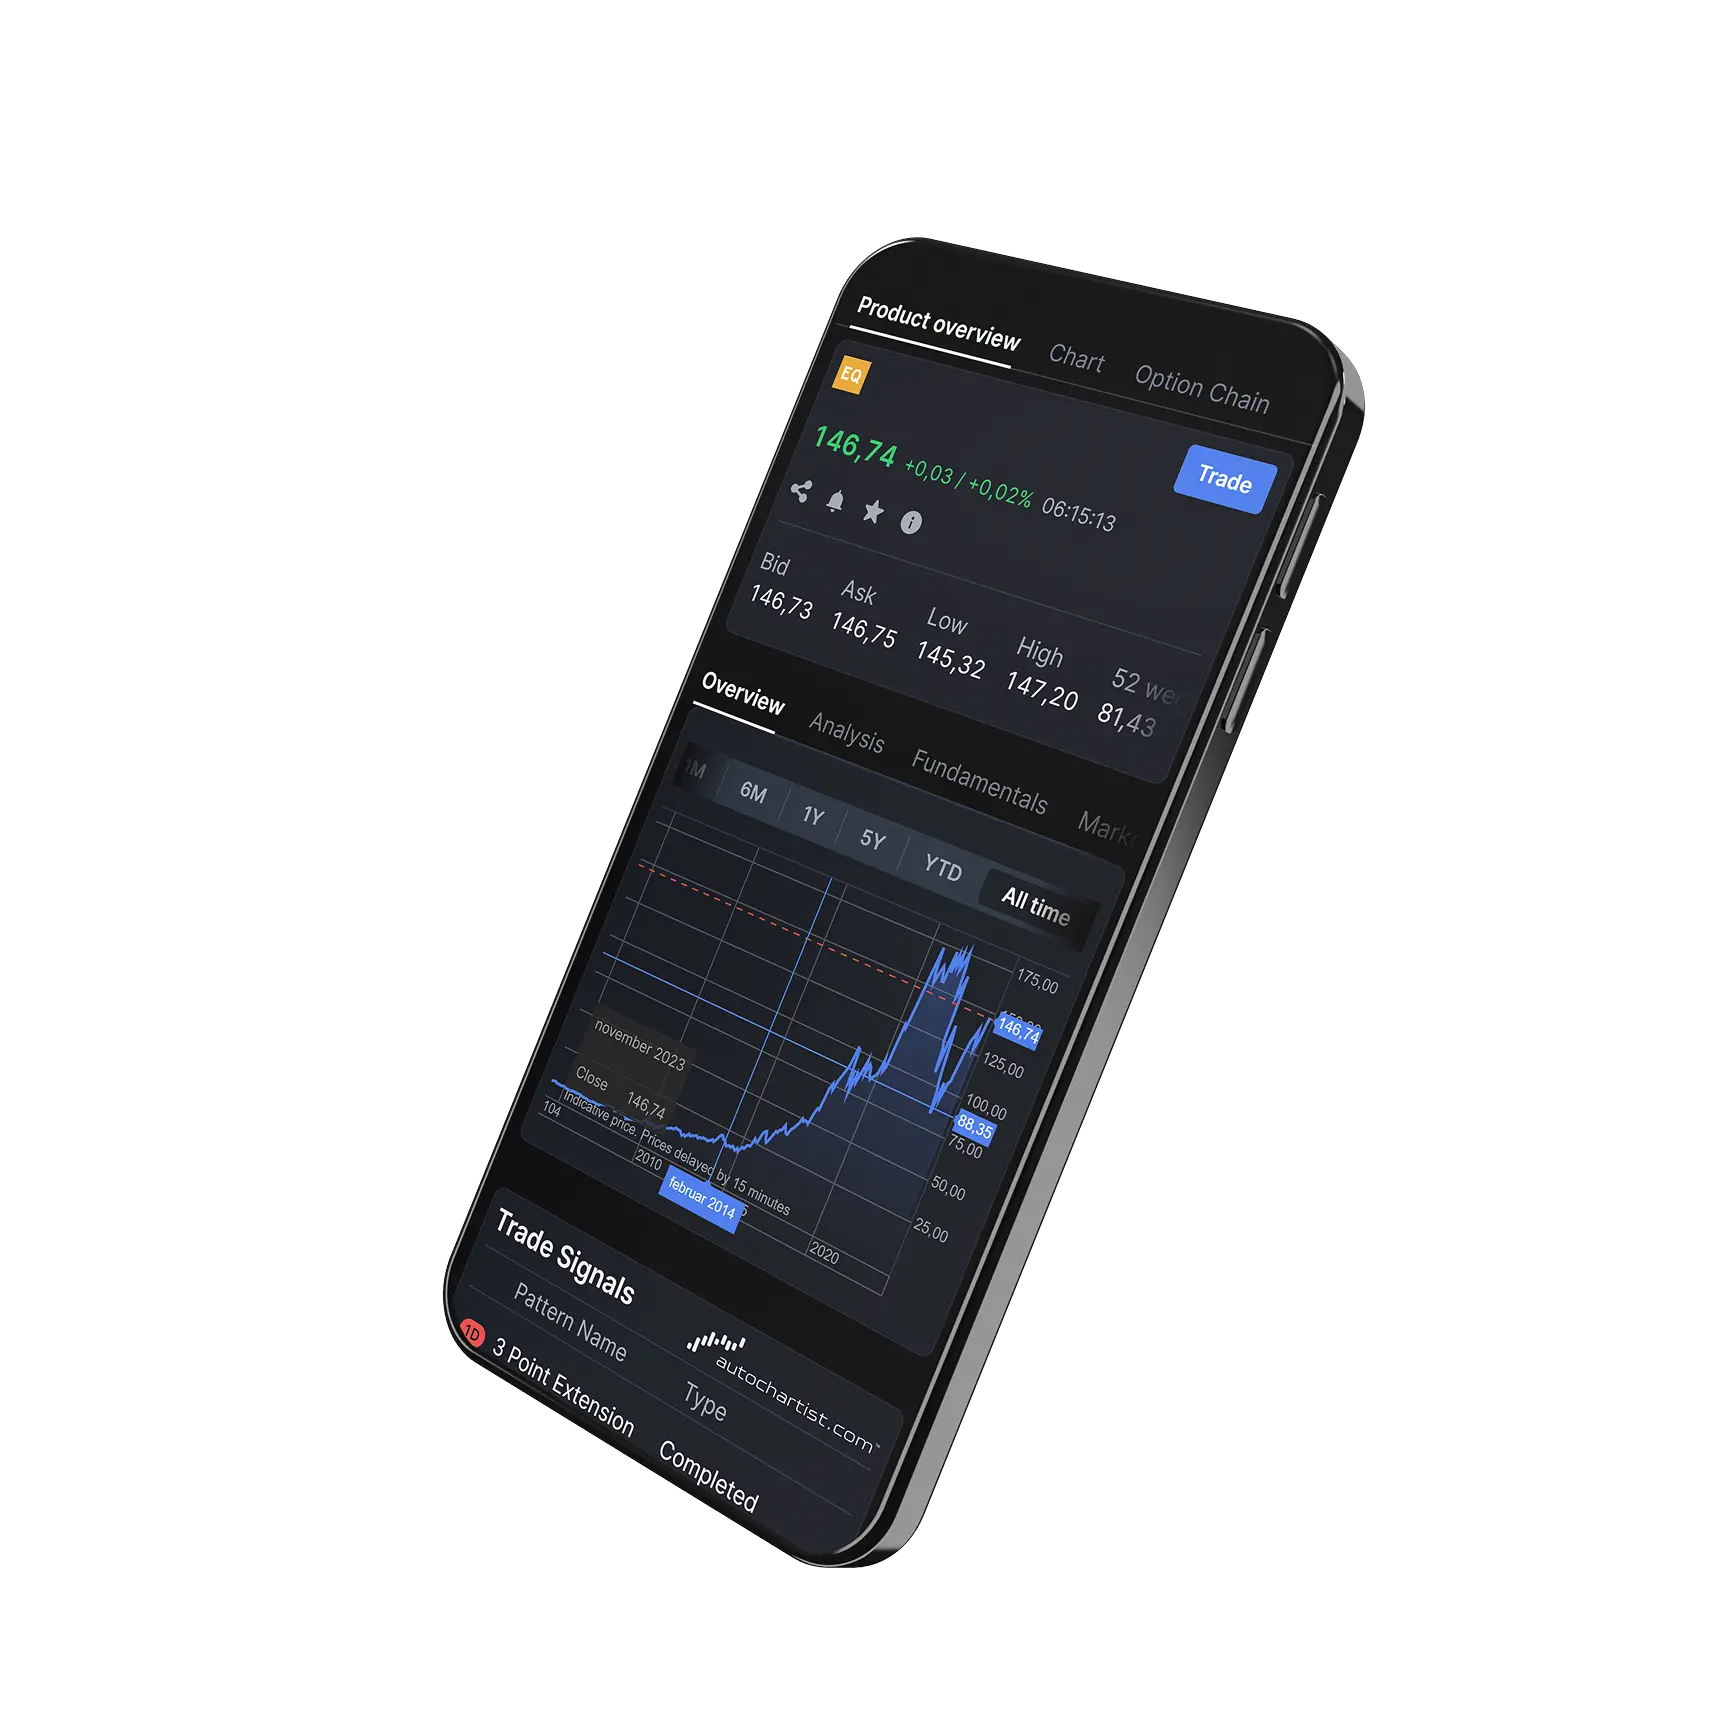
Trade signals can be a useful indicator when making trading decisions. The arrow icons represent the time interval and the direction of the breakout:
- Green arrow (up) – Indicates a potential upward breakout
- Red arrow (down) – Indicates a potential downward breakout
- Grey = Pattern emerging – Suggests that a technical pattern is currently forming
To learn more, simply click on the trade signal icon you're interested in. This will open a live chart displaying:
- The active pattern
- Key support and resistance levels
- Real-time price action
You can navigate the chart as usual and reset the chart at any time by selecting the reset option provided.
Take total control of your portfolio, today.
Trade smarter with Totality - formerly Saxo Australia. Join 1,000s of investors building global portfolios with low fees, local support, and world-class platforms.

Institutional-grade trading infrastructure powered by Saxo
Totality platforms are built on Saxo’s global trading infrastructure, providing deep liquidity, robust execution, and enterprise-level reliability trusted by financial institutions worldwide.


Totality is the Official Online Trading Partner of Sydney's Allianz Stadium
From bespoke matchday experiences to unrivalled networking opportunities, our partnership with Allianz Stadium puts Totality clients at the heart of the action.