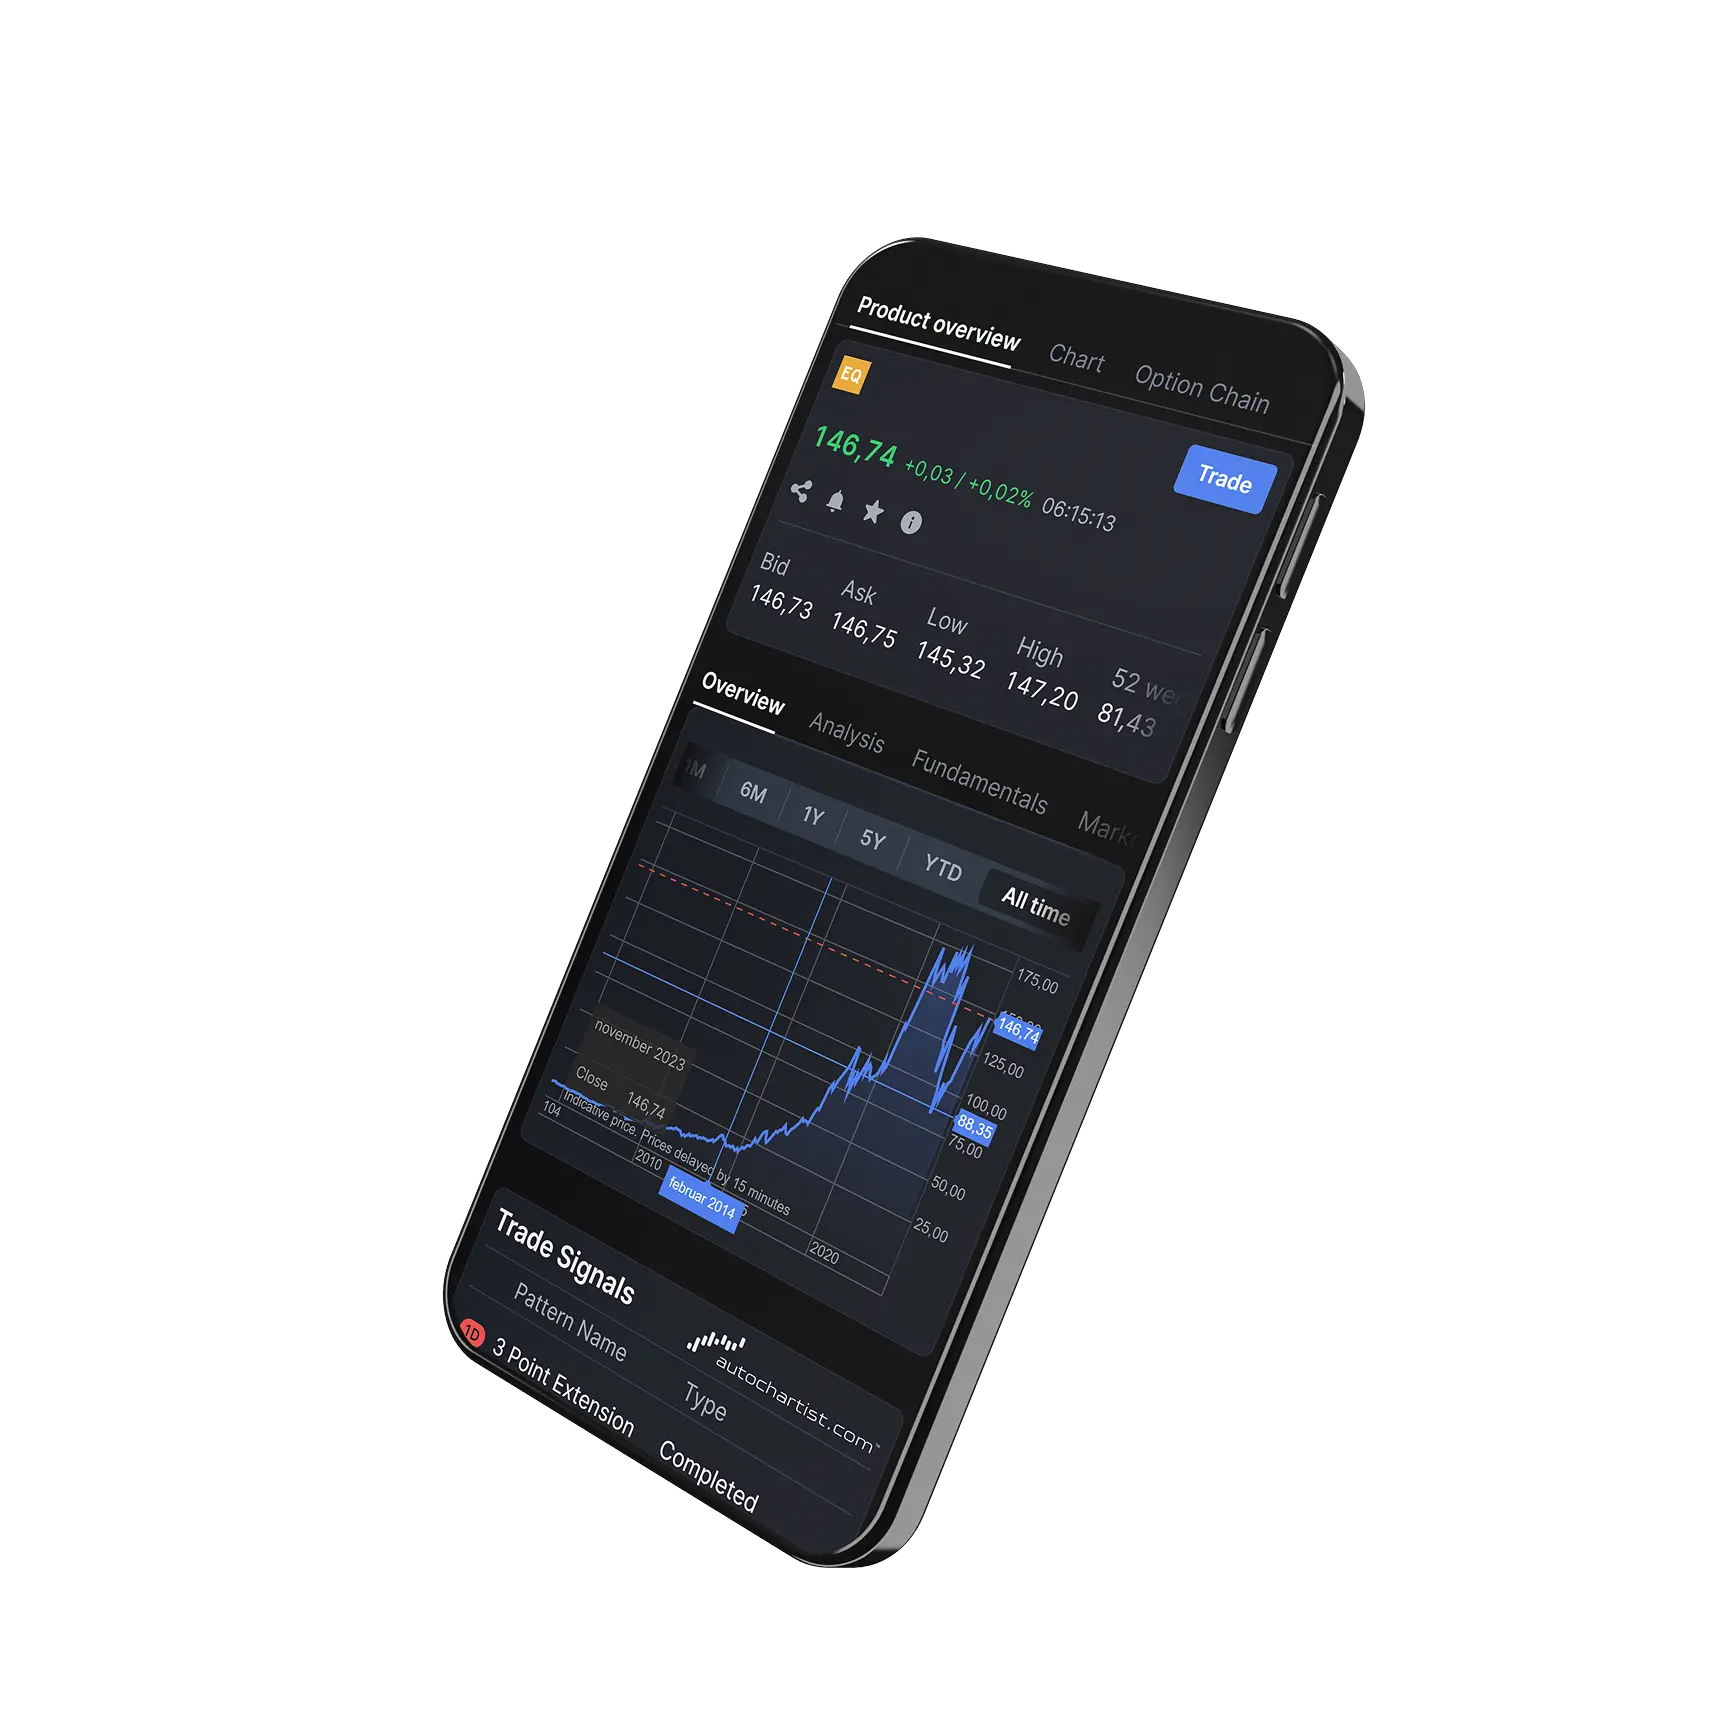
What is the 'Options risk ladder'?
The Options Risk Ladder is a dynamic tool designed to give options traders a quick snapshot of their portfolio’s risk exposure. This is commonly referred to as the “Greeks”
What do Option Risk Ladders measure:
The ORL calculates and displays the following metrics for various spot price levels:
- PV Change (change in portfolio value)
- Delta
- Vega
- Theta
You can customise the range of spot values to suit your analysis needs.
Please note: The Options Risk Ladder in Totality is a model-based tool designed to simulate how your portfolio’s risk metrics such as Delta, Vega, and Theta might respond to changes in the underlying asset’s price.
However, please be aware of the following limitations:
- Model-Based Estimates Only: The ORL is mark-to-model, meaning it provides theoretical projections rather than guaranteed outcomes. It should not be relied upon to predict actual portfolio changes under market stress.
- Not for Margin Management: The ORL is not intended for managing margin requirements or anticipating margin calls. Use dedicated margin tools for that purpose.
- Partial Instrument Coverage: The ORL includes only a subset of instruments available on the Totality platform. Any instruments not included in this subset will not be reflected in the ORL’s results.
How to view the Options Risk ladder
Click 'add module' -> options risk ladder.
Equity Options – Understanding Key Metrics
PV Change
Represents the projected change in the portfolio’s mark-to-market (MTM) value based on movements in the underlying share price.
Example: If the PV change is +A$25,000 for a 2% drop in the underlying, the portfolio is expected to gain A$25,000 if the share price falls by 2%, assuming all other factors remain constant.
Delta
Measures the change in portfolio value for a 1% increase in the underlying share price.
Example: A delta of –A$10,000 on AAPL shares means a 1% rise in AAPL’s price would result in a A$10,000 loss, while a 1% drop would yield a A$10,000 gain.
Vega
Indicates the change in portfolio value for a 1 percentage point increase in implied volatility.
Example: If implied volatility on AAPL is 40% and Vega is +A$5,000, a rise to 41% would increase the portfolio’s value by A$5,000. A drop to 39% would reduce it by the same amount.
Reflects the expected change in portfolio value from the passage of one day, assuming no other changes.
Example: A theta of –A$100 means the portfolio would lose A$100 over the next day due to time decay.
Take total control of your portfolio, today.
Trade smarter with Totality - formerly Saxo Australia. Join 1,000s of investors building global portfolios with low fees, local support, and world-class platforms.
Institutional-grade trading infrastructure powered by Saxo
Totality platforms are built on Saxo’s global trading infrastructure, providing deep liquidity, robust execution, and enterprise-level reliability trusted by financial institutions worldwide.


Totality is the Official Online Trading Partner of Sydney's Allianz Stadium
From bespoke matchday experiences to unrivalled networking opportunities, our partnership with Allianz Stadium puts Totality clients at the heart of the action.